Machine Learning in Digital Analytics: Unlocking Insights with the Semantic Layer
Authors

Asad Ali
Principal Consultant, Consulting Technology, Media, Entertainment

VinothKumar Kolluru
Senior Data Scientist, AI Client Services

Simran Padam
Senior Data Scientist, AI Client Services
This is the 2nd paper in our Series: Enhancing Digital Outcomes with Advanced Analytics. Read Paper 1 here to understand the opportunity landscape.
Introduction
The power of digital data lies in the richness with which granular user interactions can be captured. Starting with what all pages were touched, down to the precise order and signals of excitement and frustration at each turn, each level of granularity unlocks the potential for the next level of actionable insights. However, collecting this data is only the first step; the real challenge lies in converting this raw digital footprint into actionable insights. The Semantic Layer sits at the heart of this transformation, serving as a structured framework that organizes and standardizes data, enabling machine learning (ML) models to deliver more accurate predictions and clearer insights.
The Semantic Layer helps translate raw, granular data from diverse sources, e.g., website & app activity, D2C campaign response, customer level signals (CRM and 3rd party), into a set of data assets that capture rich behavioral markers at various levels of identity and engagement. This approach helps decision-makers, analysts, and data scientists across the organization to work with the same definitions, leading to more accurate insights and enabling scalable machine learning initiatives. In essence, the Semantic Layer ties everything together, creating a “common language” for digital analytics that spans lines of business, functions, and markets.
This article provides an in-depth look at how Semantic Layers can be architected to power highly effective advanced analytics and ML modeling. We focus on our primary data source – website clickstream data – against which other data sources can be mapped, based on the availability of IDs that can be stitched. Specifically, we cover the following key dimensions of Semantic Layers:
Grain of identity: Aggregating raw clickstream data at different levels of granularity to power a diverse range of use cases.
Feature engineering: Conceptualizing feature families to capture diverse behavioral patterns at each granularity.
Advanced techniques: A quick sneak peek into innovative approaches beyond traditional feature engineering.
Ultimately, we will illustrate how a well-defined Semantic Layer can empower organizations to make more impactful, data-driven decisions—whether optimizing conversion funnels, personalizing user experiences, or identifying new marketing opportunities.
Grain of identity
A grain of identity refers to the various levels of aggregation possible within clickstream data, ranging from the highest level (customer ID) to the lowest (a single digital interaction, called a ‘hit’). Below, we illustrate this hierarchy with an example:
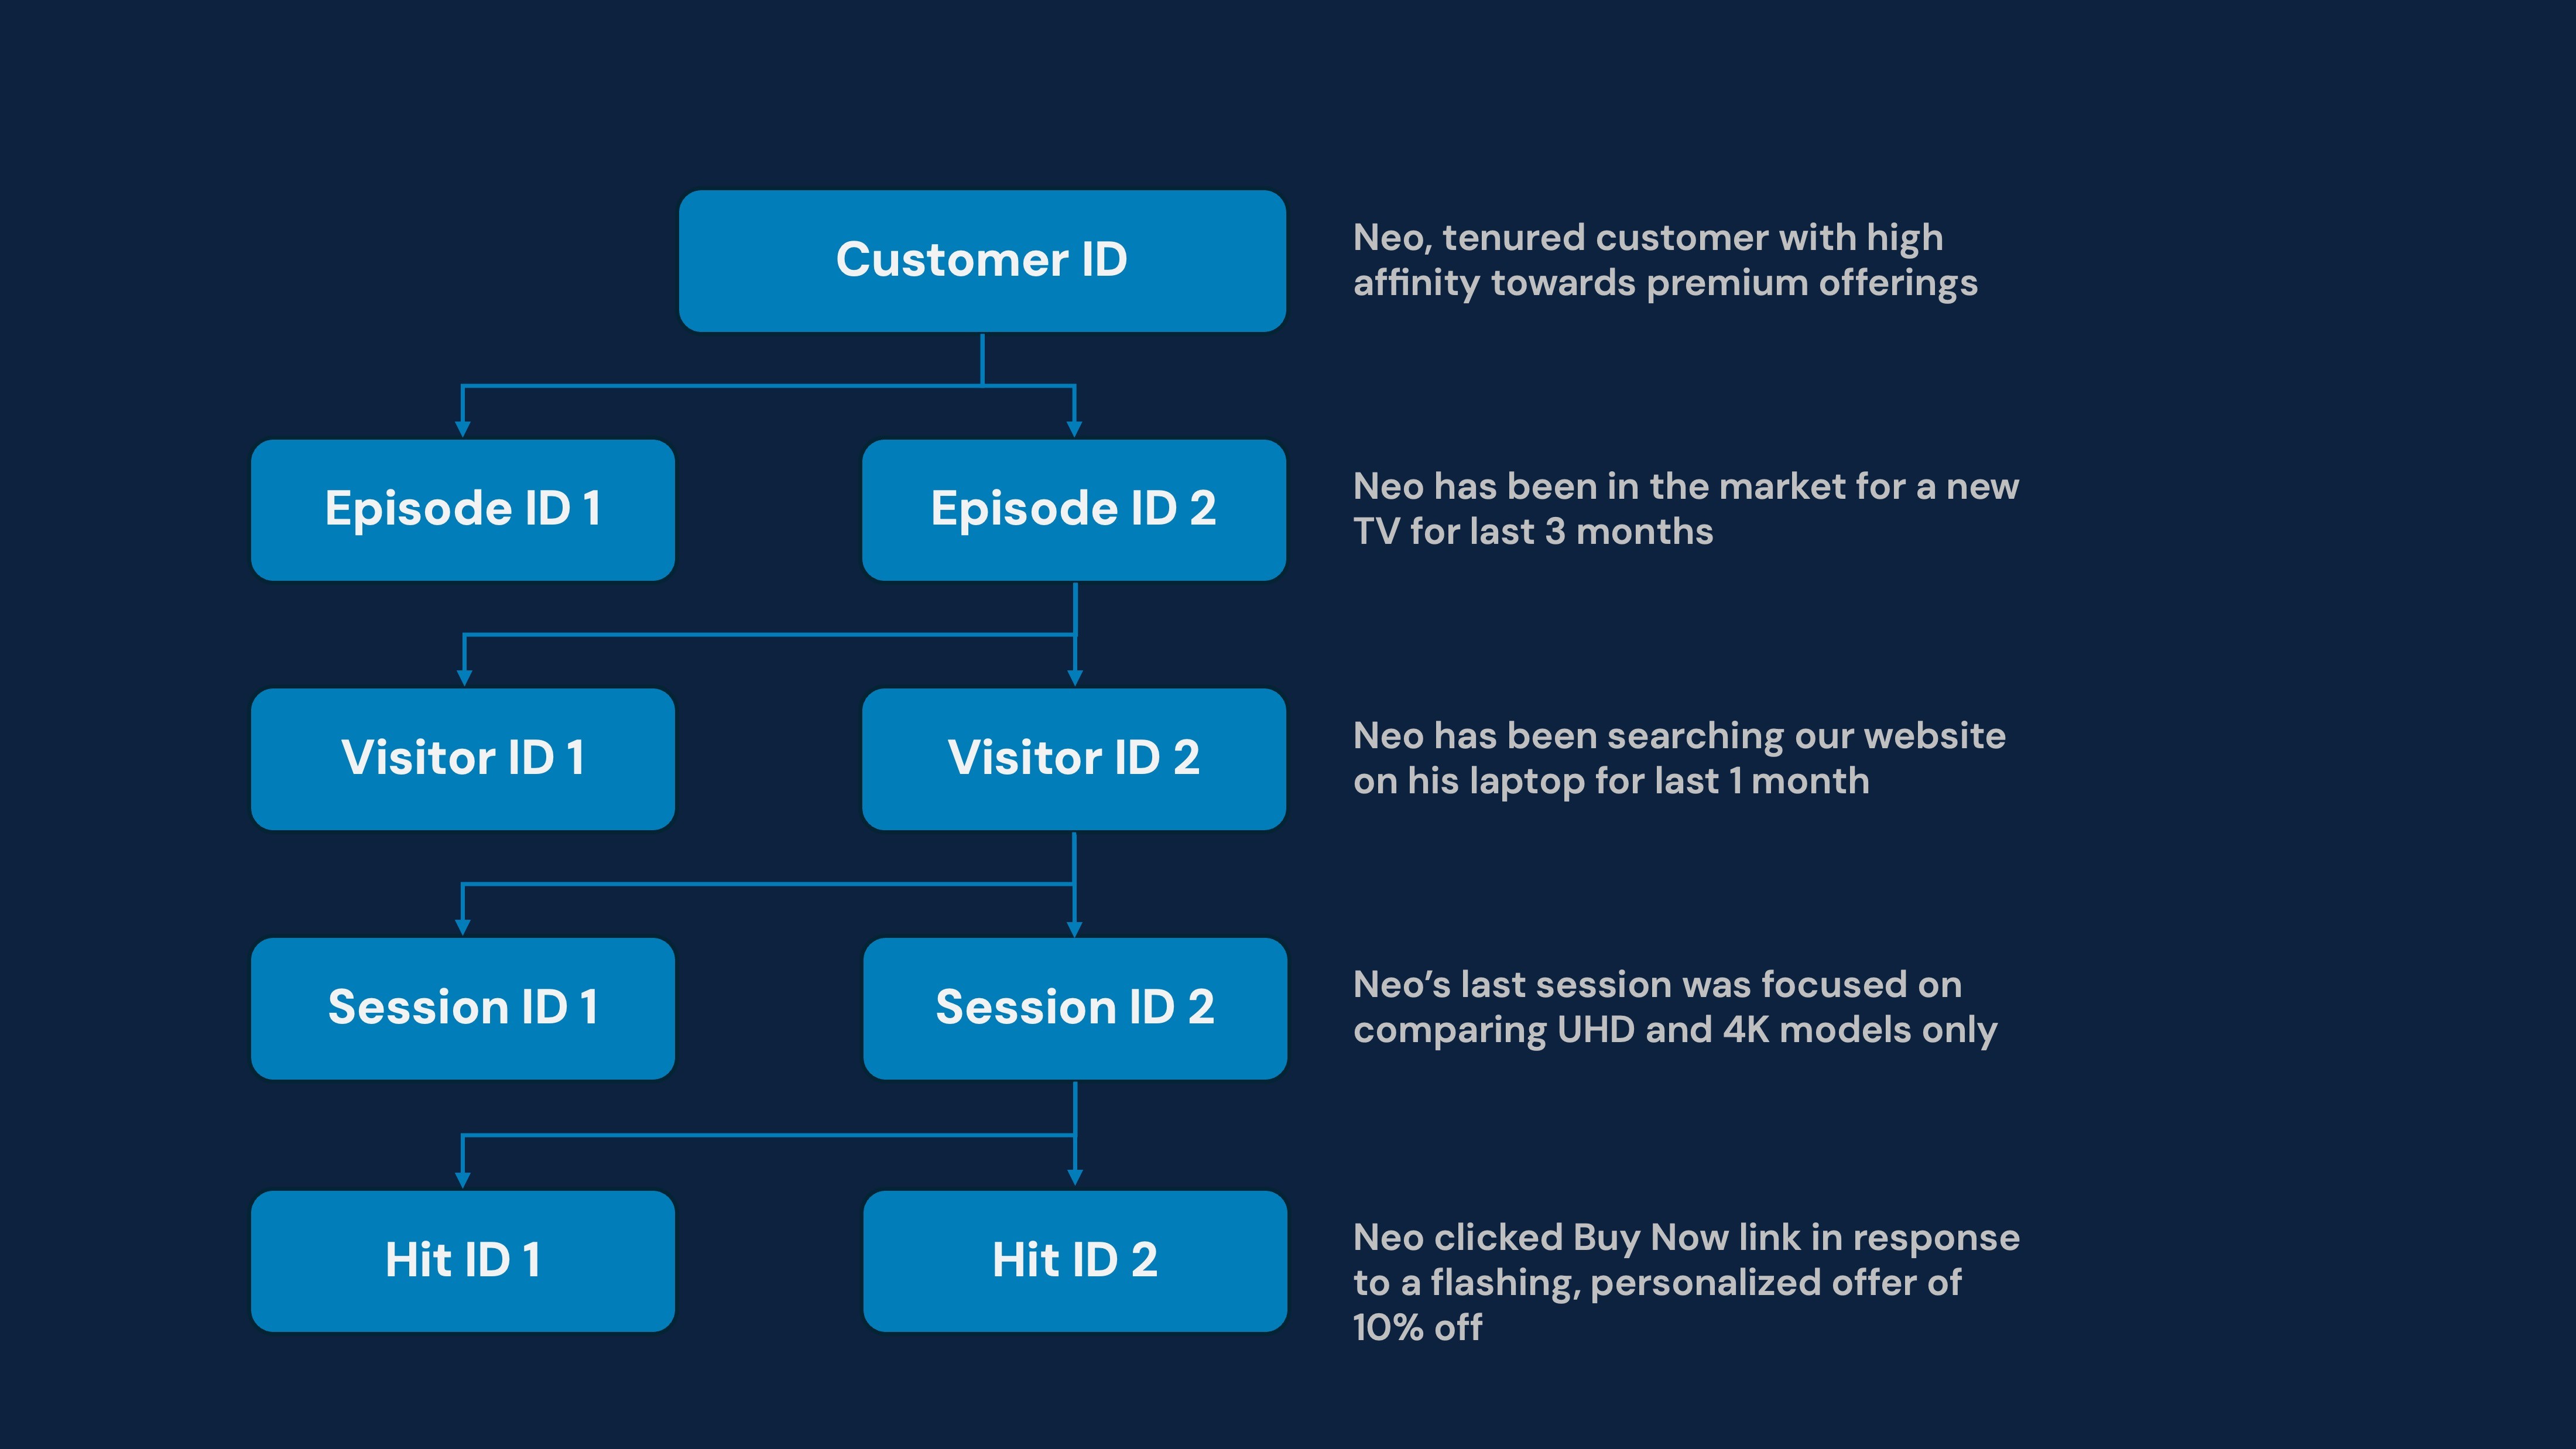
A. Hit-level data
Hit-level data refers to the most granular layer of user interactions, capturing every individual event, such as a pageview, button click, or form submission, in its raw form. In platforms like Adobe Analytics or Google Analytics, the raw data stream is inherently hit-level, recording each discrete action a user performs. This level of detail can be exceptionally valuable for uncovering micro-behaviors, for example, precisely detecting when a visitor abandons the cart or how they navigate through dynamic page elements. However, because it produces large volumes of data, hit-level information often needs to be aggregated, sequenced, or otherwise transformed (e.g., into session- or user-level metrics) to be practical for advanced analytics and machine learning applications.
B. Session-level data
A session represents a single block of user engagement, typically constrained by a time threshold or an idle limit (e.g., if the user visited the website 3 times in a day but had a gap of 60 minutes between each instance, the hit-level data will be summarized into 3 distinct sessions). By grouping micro-interactions into a single session, businesses can more clearly evaluate how users navigate and what triggers engagement or exit. For instance, an e-commerce user’s session might begin the moment they land on the homepage, continue through product searches and reviews, and end when they either make a purchase or leave the site.
Well-defined sessions help analysts identify areas of friction or excitement in the user journey. They also allow marketing teams to see where in the funnel prospective buyers drop off, guiding future strategies for retargeting or A/B testing.
C. Visitor-level data
Visitor-level insights and customer profiling involve zooming out from individual sessions to understand a single visitor’s behavior across various sessions. This is made possible by cookies, which can help stitch together multiple sessions from the same visitor (as long as they occur on the same device and browser). By aggregating data at this level, organizations gain a more cohesive view of user journeys, allowing them to understand the end-to-end journey and identify opportunities where visitors are most susceptible to drop-off/friction. E.g., a visitor may research for the first three sessions, compare models and purchase options for the subsequent two sessions, and use the last session to finalize the purchase. More sessions may follow for order tracking and post-sales support.
D. Episode-level data
Episode-level analysis segments a user’s overall journey into discrete “episodes” based on intent or outcome. For example, consider a 30-day user journey on an online marketplace specializing in furniture:
Episode 1: The user is searching for a new sofa for their living room, reviewing multiple options, but ultimately decides not to purchase.
Episode 2: 3 weeks later, the user is now searching for a decorative item, and chooses to purchase with gifting options, suggesting it’s not for their personal use.
By isolating these episodes, analysts can observe how intentions shift, identify the factors that motivate conversion, and pinpoint where the user may lose interest. This breakdown is handy for personalization engines, as it ensures recommendations are relevant to the user’s current focus rather than a past interest that has lapsed.
E. Customer-level data
Finally, all activity can be consolidated at the customer level, meaning a single customer may have accessed the site via different devices, sessions, and formats (.com versus app). This approach works effectively when customers use a single login across all touchpoints and provides detailed insights, for example.
Detect device- and format-level patterns, e.g., preferring an app for upper-funnel research and a desktop site for conversion.
Understand long-term engagement trends, whether the user is primarily motivated by deals (e.g., clicks on deal emails) or brand loyalty (comes in directly to the Homepage).
Build churn prediction and next-best-action models.
Customer-level stitching is generally available when visitors are asked to log in, and even pre-login interactions can be stitched using cookies and browser fingerprinting techniques. More importantly, customer-level granularity also benefits from the synthesis of 1st party CRM data (e.g., purchase history, relationship strength) and other 3rd party data (affinities, interests, demographics, …)
Feature engineering for the semantic layer
Feature engineering is the art and science of transforming raw data into signals that a machine learning model can interpret effectively. By leveraging the Semantic Layer, organizations can extract, refine, and standardize features that illuminate user behavior and market dynamics. Below, we illustrate one example of the Session Level Semantic Layer (also called a Data Hub)
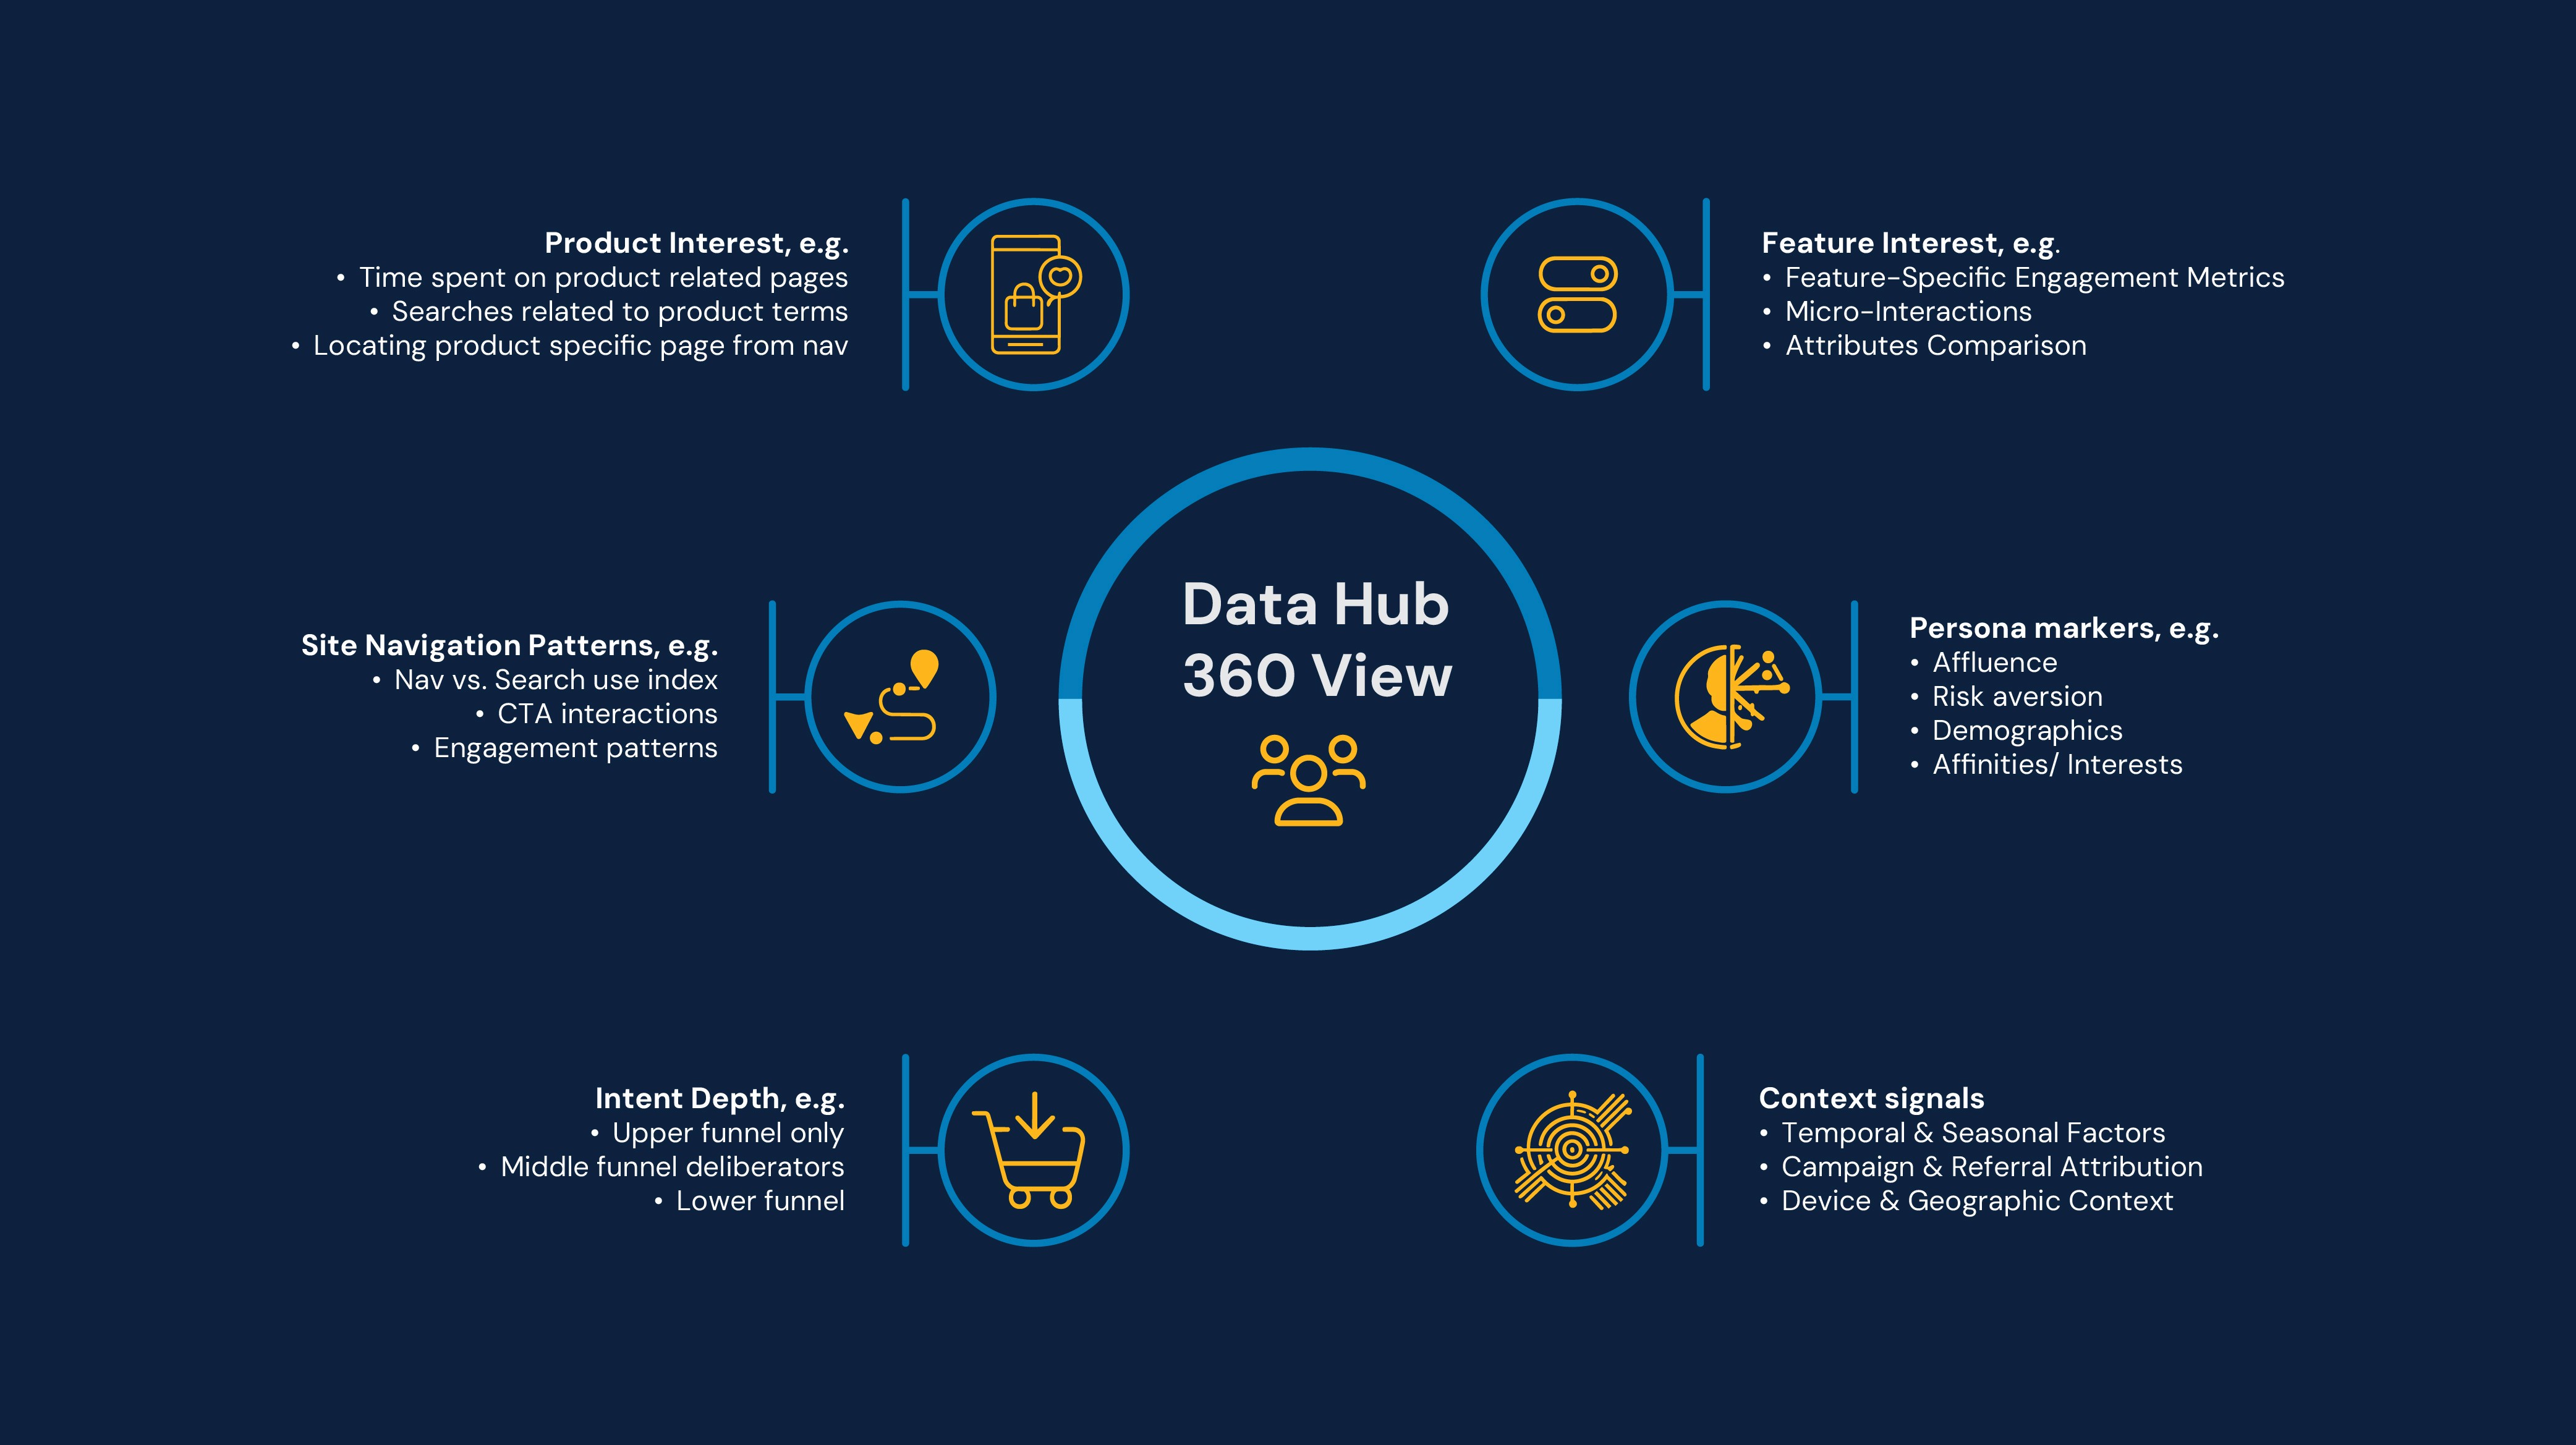
Product interest
Product interest gauges how deeply a user engages with specific products or topics. For instance, time spent on product description pages or the search frequency of returning to a product page related terms can signal high “product-centric” intent. Imagine a user who compares “model X” with multiple other models or visits the product detail and specs page multiple times. A few simple approaches to capture product level are:
Time spent on model X product pages
Searches related to model X
Selecting model X in the comparison dropdowns
The idea can be further generalized at the category/ sub-category level, depending on the breadth and hierarchy of the business catalog.
Feature-interest
In contrast to product-specific interest, feature-specific engagement helps capture which aspects of a product drive user attention. E.g., for automobiles, it might be mileage or safety features; for clothing, sustainability ratings or material quality. To capture how users interact with individual features, let us consider an automobile example with specific vehicle attributes, such as battery-range sliders and an autopilot demo video.
Feature-specific engagement metrics (such as time spent adjusting the battery range slider, number of Autopilot demo video plays, or clicks on the drag-and-drop wheel selector).
Micro-interactions (such as tooltip expansions for child-seat installation, hoverovers on safety-feature icons, or 360° interior-view toggles).
Attribute comparison insights (such as repeated visits to the “0–60 mph” chart, side-by-side cargo volume table usage, or clicks on brake-torque vs. horsepower graphs).
Site navigation patterns
Site navigation examines how users navigate an entire site, from their entry point and the path they take to where they ultimately exit. This can help understand each user's natural browsing patterns, providing a clear signal when combined with other signals.
Some important navigation patterns that can capture user behavior are:
Nav-based vs. Search-based: do they use menus to navigate or search, respectively, a proxy for site familiarity vs. catalog familiarity.
CTA interactions: Are they easy to take along on a curated journey using CTAs, or do they have their own journey pattern in mind?
Engagement patterns: How long do they take to read specs or reviews? Do they prefer videos, animations, or text?
User persona markers
In cases where direct signals from the CRM database/3rd-party fusion are not available, persona markers can be inferred from site behavior using specific domain context. E.g.
Affluence level: Which price filters they apply, interactions with buy-now-pay-later options, searches for trade-in or refurbished options.
Risk aversion: Exploring extended warranty, insurance, and return policies.
CRM and 3rd party signals can significantly clear up this picture by adding higher-quality signals, like;Demographics: Age range, gender, income range, family size, etc.
Affinities/ interests: Sports enthusiast, frequent traveler, deal seeker, etc.
Intent depth
This category focuses on how far users go, suggesting their level of readiness or interest in our website:
Upper funnel only – Not going beyond home or category pages.
Middle funnel deliberators – Going to comparisons, reviews, FAQs, etc.
Lower funnel –Detailed customer service interactions, purchase options exploration, culminating in purchase.
Context signals
Context signals account for external conditions that can affect user behavior, like the time of day, local weather, device type, or referral source. For example, a travel booking site might find that more bookings occur on weekends, or that mobile users are likely to complete impulse purchases late at night. By tuning content and offers to these contexts, businesses can deliver highly relevant experiences.
Temporal and seasonal dynamics
This signal captures when users visit (time of day, day of the week, holidays, …), or the number of days since a new model launch. For example, if weekday mornings show a spike in finance-calculator usage, you might surface quick-quote widgets earlier in the flow. Likewise, noticing that interest in a limited-edition trim surges two weeks after release can trigger a targeted email reminding users to reserve before the stock runs low.
Campaign and referral triggers
By tagging sessions with their entry source—paid ads, organic search terms, email blasts, or social posts- you can see which marketing efforts drive the most qualified traffic. Suppose visitors from a “Summer EV Event” campaign click directly into the Design Studio and stay longer than the average visitor. In that case, you can optimize that landing page to highlight special paint-and-wheel offers, translating clicks into reservations more effectively.
Access device and geographic context
Understanding the device type (desktop, mobile, in-showroom kiosk) and the approximate region (urban, suburban, rural) helps you tailor the UI and messaging. For instance, mobile users in rural markets might prioritize range information over luxury features, so presenting a quick-range estimator up front boosts engagement. Conversely, kiosk users at urban dealerships could see localized test-drive invitations based on their ZIP code, resulting in increased in-person bookings.
Advanced techniques
Although the techniques mentioned above provide a solid starting point for a functional and practical semantic layer, there are multiple novel approaches, primarily driven by advances in Machine Learning and the Generative AI space, that can help take Semantic Layers to the next level. Below is a brief introduction to a few top approaches that can be explored to capture richer signals from large data assets -
Journey embeddings: Creating a journey fingerprint using vector embeddings - each page view or event is treated as a token in a skip-gram Word2Vec model trained on ordered session sequences, yielding fixed-length vectors whose cosine similarities reflect shared navigational behaviors for clustering, similarity search, or as inputs to predictive models.
Sequence graph transform: By representing each user session as a directed graph, with nodes corresponding to discrete pages or events and edges weighted by transition frequency or dwell time, this approach captures the structural intricacies of customer journeys.
Self-attentive session encoding: This approach elevates personalization by automatically highlighting the critical actions within each visit that most influence purchase decisions, enabling real-time decisioning engines to serve contextually relevant incentives and thereby increase average order value.
Conclusion
The Semantic Layer is indispensable for any organization looking to leverage digital analytics effectively. By organizing raw data into logically defined sessions, aggregating behavior across user journeys, and introducing consistent metrics, the Semantic Layer converts a tangled web of clicks and page views into meaningful signals. This structure not only enhances the performance of ML models but also empowers stakeholders, from marketing teams to C-level executives, to make informed, data-driven decisions.
As the digital landscape evolves, so do user behaviors, market conditions, and competitive pressures. The flexibility and scalability of the Semantic Layer enable organizations to adapt swiftly, refining data pipelines and feature sets in real-time.
Part 3 of this series will delve further into advanced feature engineering techniques that unlock real-time segmentation, personalized content recommendations, and data-driven marketing strategies built on top of a robust Semantic Layer.
This is the 2nd paper in our Series: Enhancing Digital Outcomes with Advanced Analytics. Read Paper 1 here to understand the opportunity landscape.
Introduction
The power of digital data lies in the richness with which granular user interactions can be captured. Starting with what all pages were touched, down to the precise order and signals of excitement and frustration at each turn, each level of granularity unlocks the potential for the next level of actionable insights. However, collecting this data is only the first step; the real challenge lies in converting this raw digital footprint into actionable insights. The Semantic Layer sits at the heart of this transformation, serving as a structured framework that organizes and standardizes data, enabling machine learning (ML) models to deliver more accurate predictions and clearer insights.
The Semantic Layer helps translate raw, granular data from diverse sources, e.g., website & app activity, D2C campaign response, customer level signals (CRM and 3rd party), into a set of data assets that capture rich behavioral markers at various levels of identity and engagement. This approach helps decision-makers, analysts, and data scientists across the organization to work with the same definitions, leading to more accurate insights and enabling scalable machine learning initiatives. In essence, the Semantic Layer ties everything together, creating a “common language” for digital analytics that spans lines of business, functions, and markets.
This article provides an in-depth look at how Semantic Layers can be architected to power highly effective advanced analytics and ML modeling. We focus on our primary data source – website clickstream data – against which other data sources can be mapped, based on the availability of IDs that can be stitched. Specifically, we cover the following key dimensions of Semantic Layers:
Grain of identity: Aggregating raw clickstream data at different levels of granularity to power a diverse range of use cases.
Feature engineering: Conceptualizing feature families to capture diverse behavioral patterns at each granularity.
Advanced techniques: A quick sneak peek into innovative approaches beyond traditional feature engineering.
Ultimately, we will illustrate how a well-defined Semantic Layer can empower organizations to make more impactful, data-driven decisions—whether optimizing conversion funnels, personalizing user experiences, or identifying new marketing opportunities.
Grain of identity
A grain of identity refers to the various levels of aggregation possible within clickstream data, ranging from the highest level (customer ID) to the lowest (a single digital interaction, called a ‘hit’). Below, we illustrate this hierarchy with an example:
A. Hit-level data
Hit-level data refers to the most granular layer of user interactions, capturing every individual event, such as a pageview, button click, or form submission, in its raw form. In platforms like Adobe Analytics or Google Analytics, the raw data stream is inherently hit-level, recording each discrete action a user performs. This level of detail can be exceptionally valuable for uncovering micro-behaviors, for example, precisely detecting when a visitor abandons the cart or how they navigate through dynamic page elements. However, because it produces large volumes of data, hit-level information often needs to be aggregated, sequenced, or otherwise transformed (e.g., into session- or user-level metrics) to be practical for advanced analytics and machine learning applications.
B. Session-level data
A session represents a single block of user engagement, typically constrained by a time threshold or an idle limit (e.g., if the user visited the website 3 times in a day but had a gap of 60 minutes between each instance, the hit-level data will be summarized into 3 distinct sessions). By grouping micro-interactions into a single session, businesses can more clearly evaluate how users navigate and what triggers engagement or exit. For instance, an e-commerce user’s session might begin the moment they land on the homepage, continue through product searches and reviews, and end when they either make a purchase or leave the site.
Well-defined sessions help analysts identify areas of friction or excitement in the user journey. They also allow marketing teams to see where in the funnel prospective buyers drop off, guiding future strategies for retargeting or A/B testing.
C. Visitor-level data
Visitor-level insights and customer profiling involve zooming out from individual sessions to understand a single visitor’s behavior across various sessions. This is made possible by cookies, which can help stitch together multiple sessions from the same visitor (as long as they occur on the same device and browser). By aggregating data at this level, organizations gain a more cohesive view of user journeys, allowing them to understand the end-to-end journey and identify opportunities where visitors are most susceptible to drop-off/friction. E.g., a visitor may research for the first three sessions, compare models and purchase options for the subsequent two sessions, and use the last session to finalize the purchase. More sessions may follow for order tracking and post-sales support.
D. Episode-level data
Episode-level analysis segments a user’s overall journey into discrete “episodes” based on intent or outcome. For example, consider a 30-day user journey on an online marketplace specializing in furniture:
Episode 1: The user is searching for a new sofa for their living room, reviewing multiple options, but ultimately decides not to purchase.
Episode 2: 3 weeks later, the user is now searching for a decorative item, and chooses to purchase with gifting options, suggesting it’s not for their personal use.
By isolating these episodes, analysts can observe how intentions shift, identify the factors that motivate conversion, and pinpoint where the user may lose interest. This breakdown is handy for personalization engines, as it ensures recommendations are relevant to the user’s current focus rather than a past interest that has lapsed.
E. Customer-level data
Finally, all activity can be consolidated at the customer level, meaning a single customer may have accessed the site via different devices, sessions, and formats (.com versus app). This approach works effectively when customers use a single login across all touchpoints and provides detailed insights, for example.
Detect device- and format-level patterns, e.g., preferring an app for upper-funnel research and a desktop site for conversion.
Understand long-term engagement trends, whether the user is primarily motivated by deals (e.g., clicks on deal emails) or brand loyalty (comes in directly to the Homepage).
Build churn prediction and next-best-action models.
Customer-level stitching is generally available when visitors are asked to log in, and even pre-login interactions can be stitched using cookies and browser fingerprinting techniques. More importantly, customer-level granularity also benefits from the synthesis of 1st party CRM data (e.g., purchase history, relationship strength) and other 3rd party data (affinities, interests, demographics, …)
Feature engineering for the semantic layer
Feature engineering is the art and science of transforming raw data into signals that a machine learning model can interpret effectively. By leveraging the Semantic Layer, organizations can extract, refine, and standardize features that illuminate user behavior and market dynamics. Below, we illustrate one example of the Session Level Semantic Layer (also called a Data Hub)
Product interest
Product interest gauges how deeply a user engages with specific products or topics. For instance, time spent on product description pages or the search frequency of returning to a product page related terms can signal high “product-centric” intent. Imagine a user who compares “model X” with multiple other models or visits the product detail and specs page multiple times. A few simple approaches to capture product level are:
Time spent on model X product pages
Searches related to model X
Selecting model X in the comparison dropdowns
The idea can be further generalized at the category/ sub-category level, depending on the breadth and hierarchy of the business catalog.
Feature-interest
In contrast to product-specific interest, feature-specific engagement helps capture which aspects of a product drive user attention. E.g., for automobiles, it might be mileage or safety features; for clothing, sustainability ratings or material quality. To capture how users interact with individual features, let us consider an automobile example with specific vehicle attributes, such as battery-range sliders and an autopilot demo video.
Feature-specific engagement metrics (such as time spent adjusting the battery range slider, number of Autopilot demo video plays, or clicks on the drag-and-drop wheel selector).
Micro-interactions (such as tooltip expansions for child-seat installation, hoverovers on safety-feature icons, or 360° interior-view toggles).
Attribute comparison insights (such as repeated visits to the “0–60 mph” chart, side-by-side cargo volume table usage, or clicks on brake-torque vs. horsepower graphs).
Site navigation patterns
Site navigation examines how users navigate an entire site, from their entry point and the path they take to where they ultimately exit. This can help understand each user's natural browsing patterns, providing a clear signal when combined with other signals.
Some important navigation patterns that can capture user behavior are:
Nav-based vs. Search-based: do they use menus to navigate or search, respectively, a proxy for site familiarity vs. catalog familiarity.
CTA interactions: Are they easy to take along on a curated journey using CTAs, or do they have their own journey pattern in mind?
Engagement patterns: How long do they take to read specs or reviews? Do they prefer videos, animations, or text?
User persona markers
In cases where direct signals from the CRM database/3rd-party fusion are not available, persona markers can be inferred from site behavior using specific domain context. E.g.
Affluence level: Which price filters they apply, interactions with buy-now-pay-later options, searches for trade-in or refurbished options.
Risk aversion: Exploring extended warranty, insurance, and return policies.
CRM and 3rd party signals can significantly clear up this picture by adding higher-quality signals, like;Demographics: Age range, gender, income range, family size, etc.
Affinities/ interests: Sports enthusiast, frequent traveler, deal seeker, etc.
Intent depth
This category focuses on how far users go, suggesting their level of readiness or interest in our website:
Upper funnel only – Not going beyond home or category pages.
Middle funnel deliberators – Going to comparisons, reviews, FAQs, etc.
Lower funnel –Detailed customer service interactions, purchase options exploration, culminating in purchase.
Context signals
Context signals account for external conditions that can affect user behavior, like the time of day, local weather, device type, or referral source. For example, a travel booking site might find that more bookings occur on weekends, or that mobile users are likely to complete impulse purchases late at night. By tuning content and offers to these contexts, businesses can deliver highly relevant experiences.
Temporal and seasonal dynamics
This signal captures when users visit (time of day, day of the week, holidays, …), or the number of days since a new model launch. For example, if weekday mornings show a spike in finance-calculator usage, you might surface quick-quote widgets earlier in the flow. Likewise, noticing that interest in a limited-edition trim surges two weeks after release can trigger a targeted email reminding users to reserve before the stock runs low.
Campaign and referral triggers
By tagging sessions with their entry source—paid ads, organic search terms, email blasts, or social posts- you can see which marketing efforts drive the most qualified traffic. Suppose visitors from a “Summer EV Event” campaign click directly into the Design Studio and stay longer than the average visitor. In that case, you can optimize that landing page to highlight special paint-and-wheel offers, translating clicks into reservations more effectively.
Access device and geographic context
Understanding the device type (desktop, mobile, in-showroom kiosk) and the approximate region (urban, suburban, rural) helps you tailor the UI and messaging. For instance, mobile users in rural markets might prioritize range information over luxury features, so presenting a quick-range estimator up front boosts engagement. Conversely, kiosk users at urban dealerships could see localized test-drive invitations based on their ZIP code, resulting in increased in-person bookings.
Advanced techniques
Although the techniques mentioned above provide a solid starting point for a functional and practical semantic layer, there are multiple novel approaches, primarily driven by advances in Machine Learning and the Generative AI space, that can help take Semantic Layers to the next level. Below is a brief introduction to a few top approaches that can be explored to capture richer signals from large data assets -
Journey embeddings: Creating a journey fingerprint using vector embeddings - each page view or event is treated as a token in a skip-gram Word2Vec model trained on ordered session sequences, yielding fixed-length vectors whose cosine similarities reflect shared navigational behaviors for clustering, similarity search, or as inputs to predictive models.
Sequence graph transform: By representing each user session as a directed graph, with nodes corresponding to discrete pages or events and edges weighted by transition frequency or dwell time, this approach captures the structural intricacies of customer journeys.
Self-attentive session encoding: This approach elevates personalization by automatically highlighting the critical actions within each visit that most influence purchase decisions, enabling real-time decisioning engines to serve contextually relevant incentives and thereby increase average order value.
Conclusion
The Semantic Layer is indispensable for any organization looking to leverage digital analytics effectively. By organizing raw data into logically defined sessions, aggregating behavior across user journeys, and introducing consistent metrics, the Semantic Layer converts a tangled web of clicks and page views into meaningful signals. This structure not only enhances the performance of ML models but also empowers stakeholders, from marketing teams to C-level executives, to make informed, data-driven decisions.
As the digital landscape evolves, so do user behaviors, market conditions, and competitive pressures. The flexibility and scalability of the Semantic Layer enable organizations to adapt swiftly, refining data pipelines and feature sets in real-time.
Part 3 of this series will delve further into advanced feature engineering techniques that unlock real-time segmentation, personalized content recommendations, and data-driven marketing strategies built on top of a robust Semantic Layer.
Recognition and achievements
Select Fractal accolades

Named leader
Customer analytics service provider Q2 2025

Representative vendor
Customer analytics service provider Q1 2021

Great Place to Work
9th year running. Certifications received for India, USA, UK, and UAE
Recognition and achievements
Select Fractal accolades
Named leader
Customer analytics service provider Q2 2025
Representative vendor
Customer analytics service provider Q1 2021
Great Place to Work
9th year running. Certifications received for India, USA, UK, and UAE


Registered Office:
Level 7, Commerz II, International Business Park, Oberoi Garden City,
Off W. E. Highway Goregaon (E), Mumbai - 400063, Maharashtra, India.
Phone: +91 22 6850 5800
Email: investorrelations@fractal.ai
CIN : L72400MH2000PLC125369
GST Number (Maharashtra) : 27AAACF4502D1Z8
Registered Office:
Level 7, Commerz II, International Business Park,
Oberoi Garden City, Off W. E. Highway Goregaon (E),
Mumbai - 400063, Maharashtra, India.
Phone: +91 22 6850 5800
Email: investorrelations@fractal.ai
CIN : L72400MH2000PLC125369
GST Number (Maharashtra) : 27AAACF4502D1Z8