The four vectors for Governance in managing COVID-19
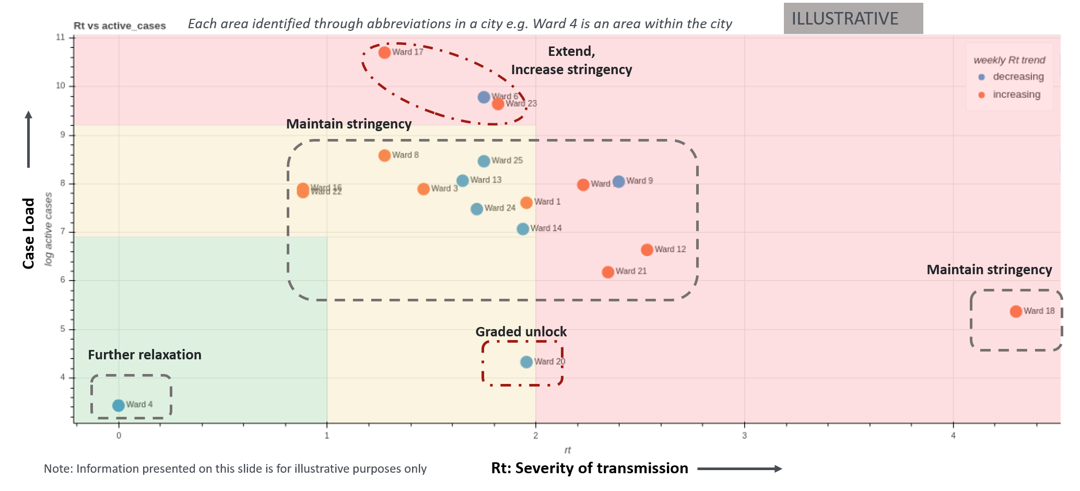
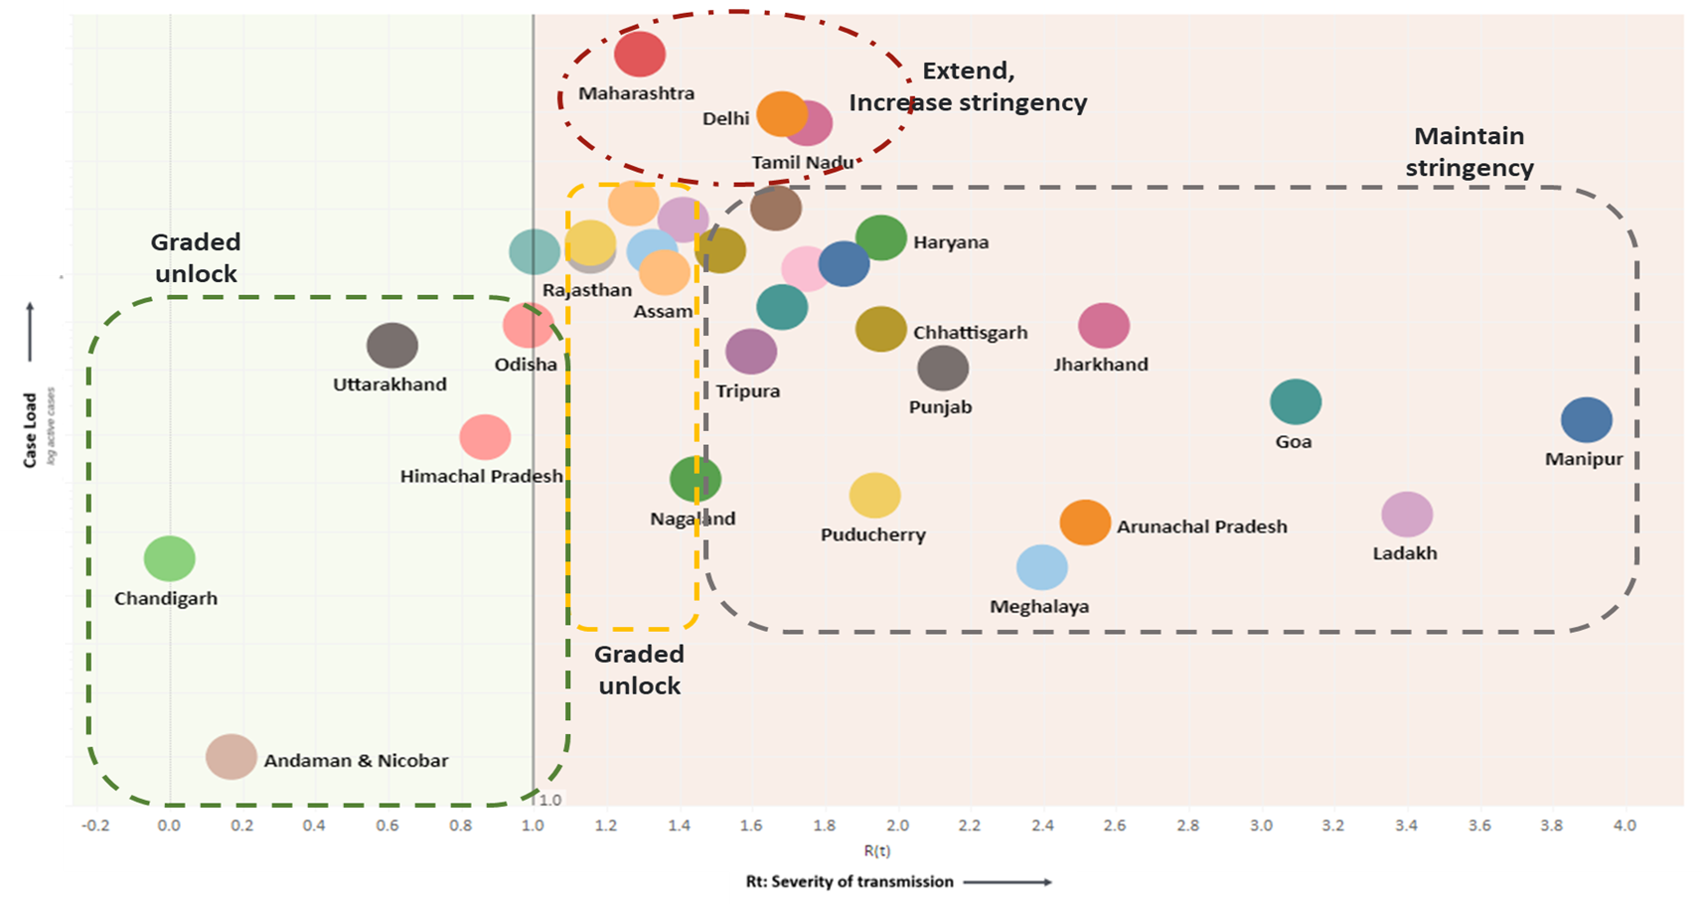
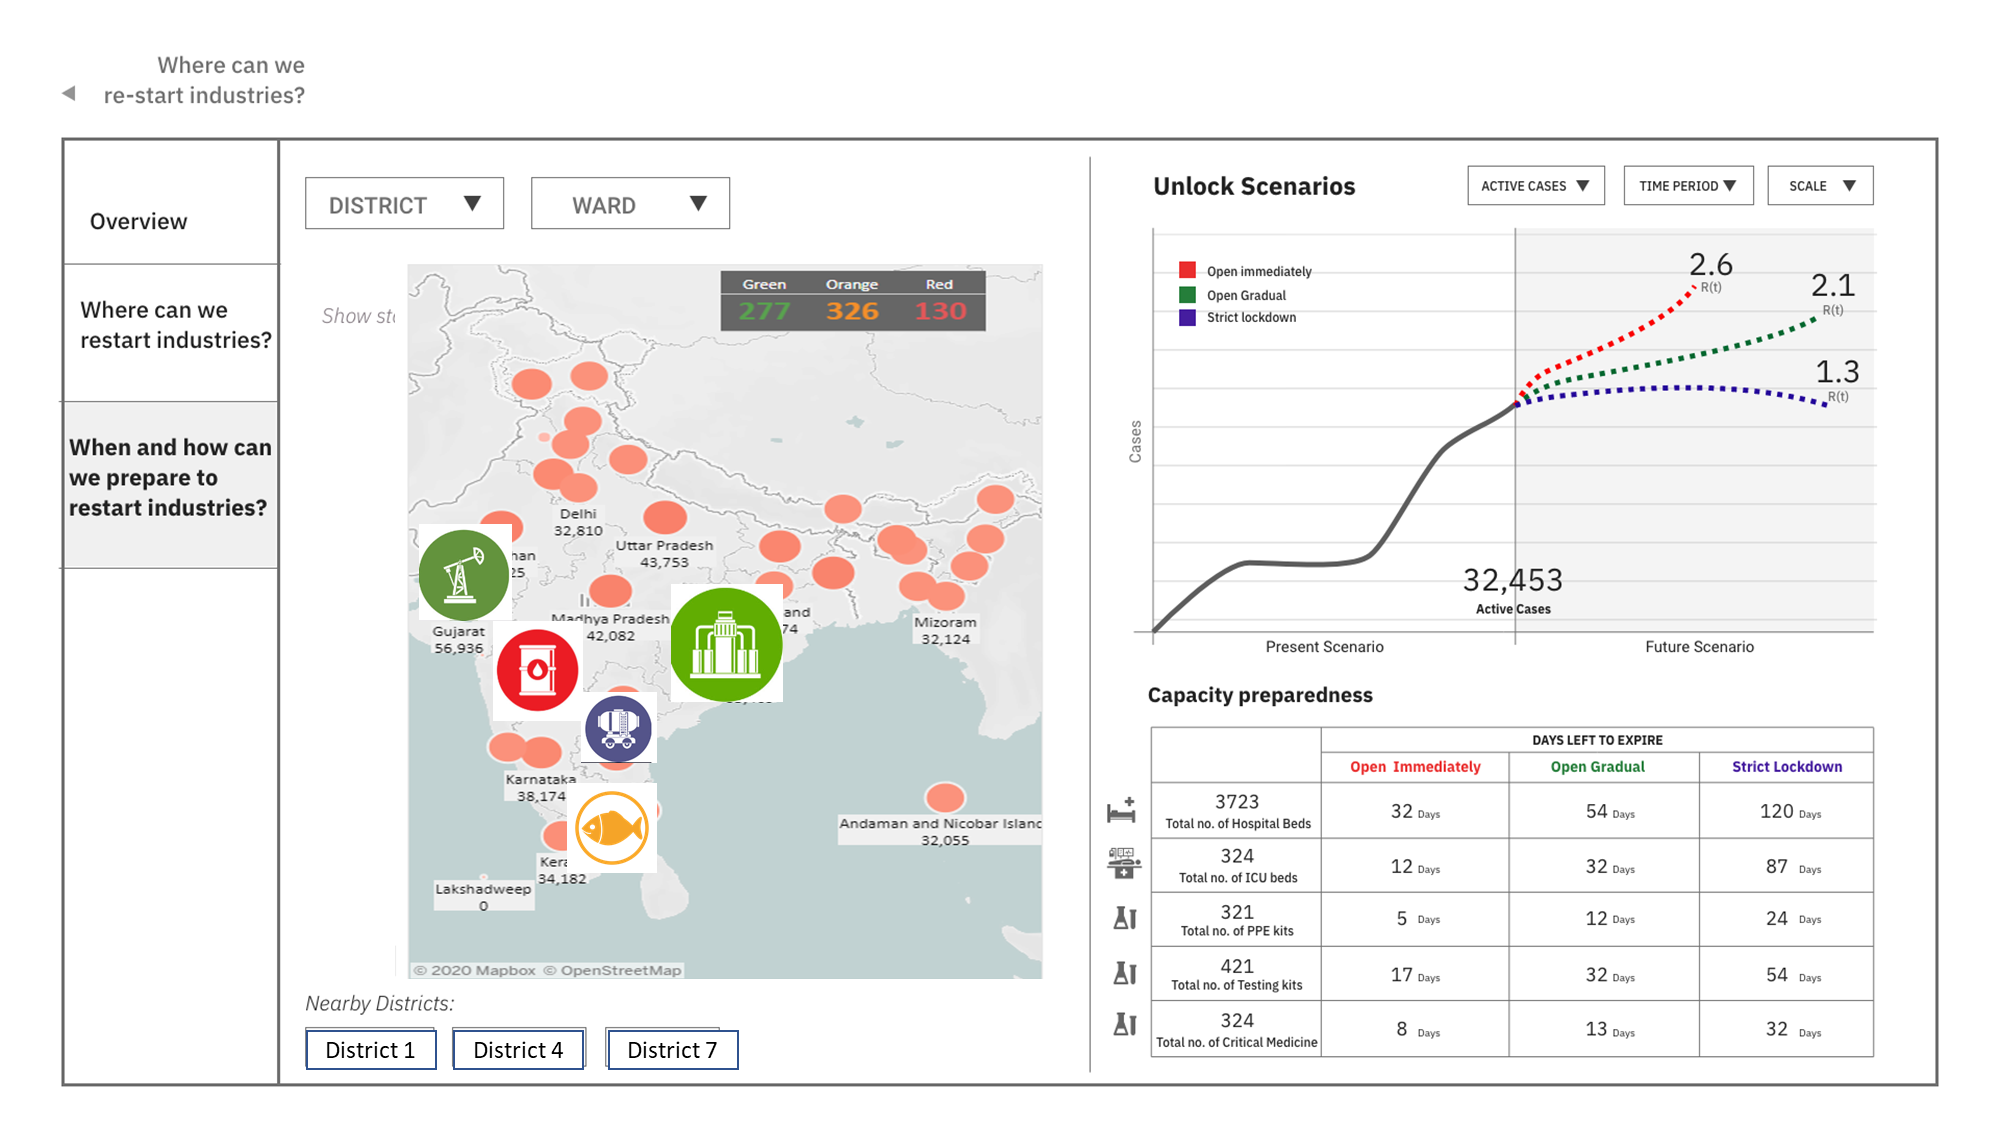
Our dashboards provide pan-India, pan-state, and by district view of hotspots and transmission rates on a single platform. It enables decision-makers to swiftly compare transmission rate, cases available, hospital capacity & deaths across different areas and prioritize resources where they are needed most.
We provide hyper-local insights on what is driving cases, so policymakers can quickly control spread, and identify local clusters and hotspots as they emerge.
The government can manage healthcare infrastructure for COVID-19 better (current and advance preparedness) based on projections. As people go back to work, the metrics to measure preparedness include the number of beds, ICUs, ventilators, dialysis equipment by wards, isolation wards, a supply of testing kits, food, and healthcare supplies, etc. The dashboard can also determine days to capacity failure based on predicted hospitalization for the state.
To manage the challenges that the scale of India’s population poses, automation with AI is uniquely suited to tackle it. The government officials can:
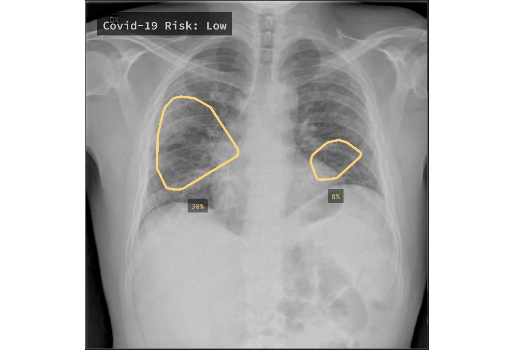
- Evaluate if a patient is at high, medium or low risk of being COVID-19 positive by analyzing their X-ray image by leveraging qure.ai
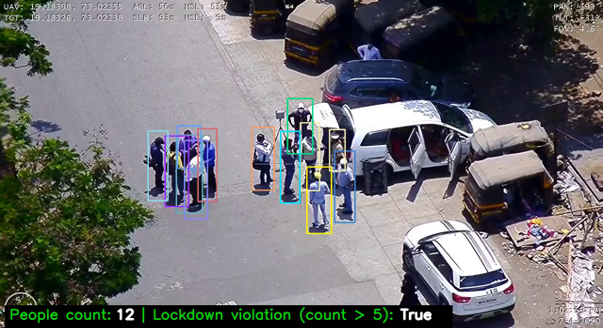
- Track whether precautionary measures are followed by the citizens in densely populated areas by monitoring drone video footage through AI video analytics algorithms
- Gauge the public sentiments such as the top of the mind concerns and any bottleneck in plan execution with social media analytics


#COVIDbus powered with qure.ai to identify and isolate high-risk suspects
Deployed in 30+ mobile vans in India and Pakistan, 50+ hospitals in India, Oman, Mexico, Italy & the UK.
Insights hub

Lead your way out of the pandemic
Helping CXO’s in solving top of the mind problems :
- What should I be focusing on to stabilize my business operations?
- How can I keep my remote workforce motivated and productive?
- How do I coordinate my team activities during the pandemic?
In the Media

AI model used for reopening industrial areas

Corona warriors: How tech titans are helping govts fight the pandemic

The groundbreaking way to search lungs for signs of COVID-19

Karnataka introduces Covid-19 tracking platform built by Nasscom

Oman’s Ministry of Health launches ‘Tarassud+’


